Migration from Andean countries (Venezuela included) accounts for at least 13 million nationals living abroad, spread out among different continents and regions in the world. Since 2020, the number of people from the Andean region has increased to more than 1.5 million, half of whom are from Venezuela. Although these nationalities are four percent of the total migrant population in the US, they account for more than 20 percent of all encounters at the US-Mexico border in 2023.
This migrant population in the US is remitting half of all flows reaching their homelands in the Andes, over US$10 billion in 2022 and US$11 billion in 2023. The following briefing offers a characterization of migration from the following Andean countries: Bolivia, Colombia, Ecuador, Peru, and Venezuela.
Migration in the Andean Region
The number of people from the Andean region leaving their countries has increased relative to global migration, from one percent of all migrants worldwide to four percent in 2020. This percentage may be higher as we reach the first half of 2024. When compared to other Latin American and Caribbean migrants, their share is at least 60 percent as of 2020.
FIGURE 1: ANDEAN MIGRATION TO LATIN AMERICA AND THE CARIBBEAN, 1990-2020
Source: United Nations Department of Economic and Social Affairs (UNDESA), 2020
The post-pandemic increase can be attributed largely to Venezuelan as well as Colombian and Ecuadorian migration to the US – mostly as irregular migration at the Mexico-US border. Overall, the intention to migrate seems to be significant across nationalities, with one third to half of people looking to leave in the next 12 months.[1] This intention is particularly pronounced in countries that have had sustained recent political, security, and socio-economic crises. From 2022 to 2023, Peru and Ecuador saw some of the highest increases in the intention to migrate from the Americas [2].
Figure 2: Composition of Andean Encounters at US-Mexico Border, 2020-2024
Source: Department of Homeland Security (DHS), 2024, Note: Bolivia is not included in DHS encounter data
Figure 3: Andean Share of US Border Encounters, 2019-2023
Source: Department of Homeland Security (DHS), 2024, Note: Bolivia is not included in DHS encounter data
According to US Census data, Andean migration to the US has largely consisted of Colombians, followed by a roughly even number of migrants from Ecuador and Peru. Since 2019, the Venezuelan share of Andean migration has grown, specifically in 2021 and 2023. Last year, the share of Andean migrants to the US grew as well reaching 23.6 percent of all US encounters – a rapid increase from just 3.3 percent in 2020. These increases are largely attributable to Venezuelan immigration, but steady flows of people from Colombia and Ecuador have accompanied them.
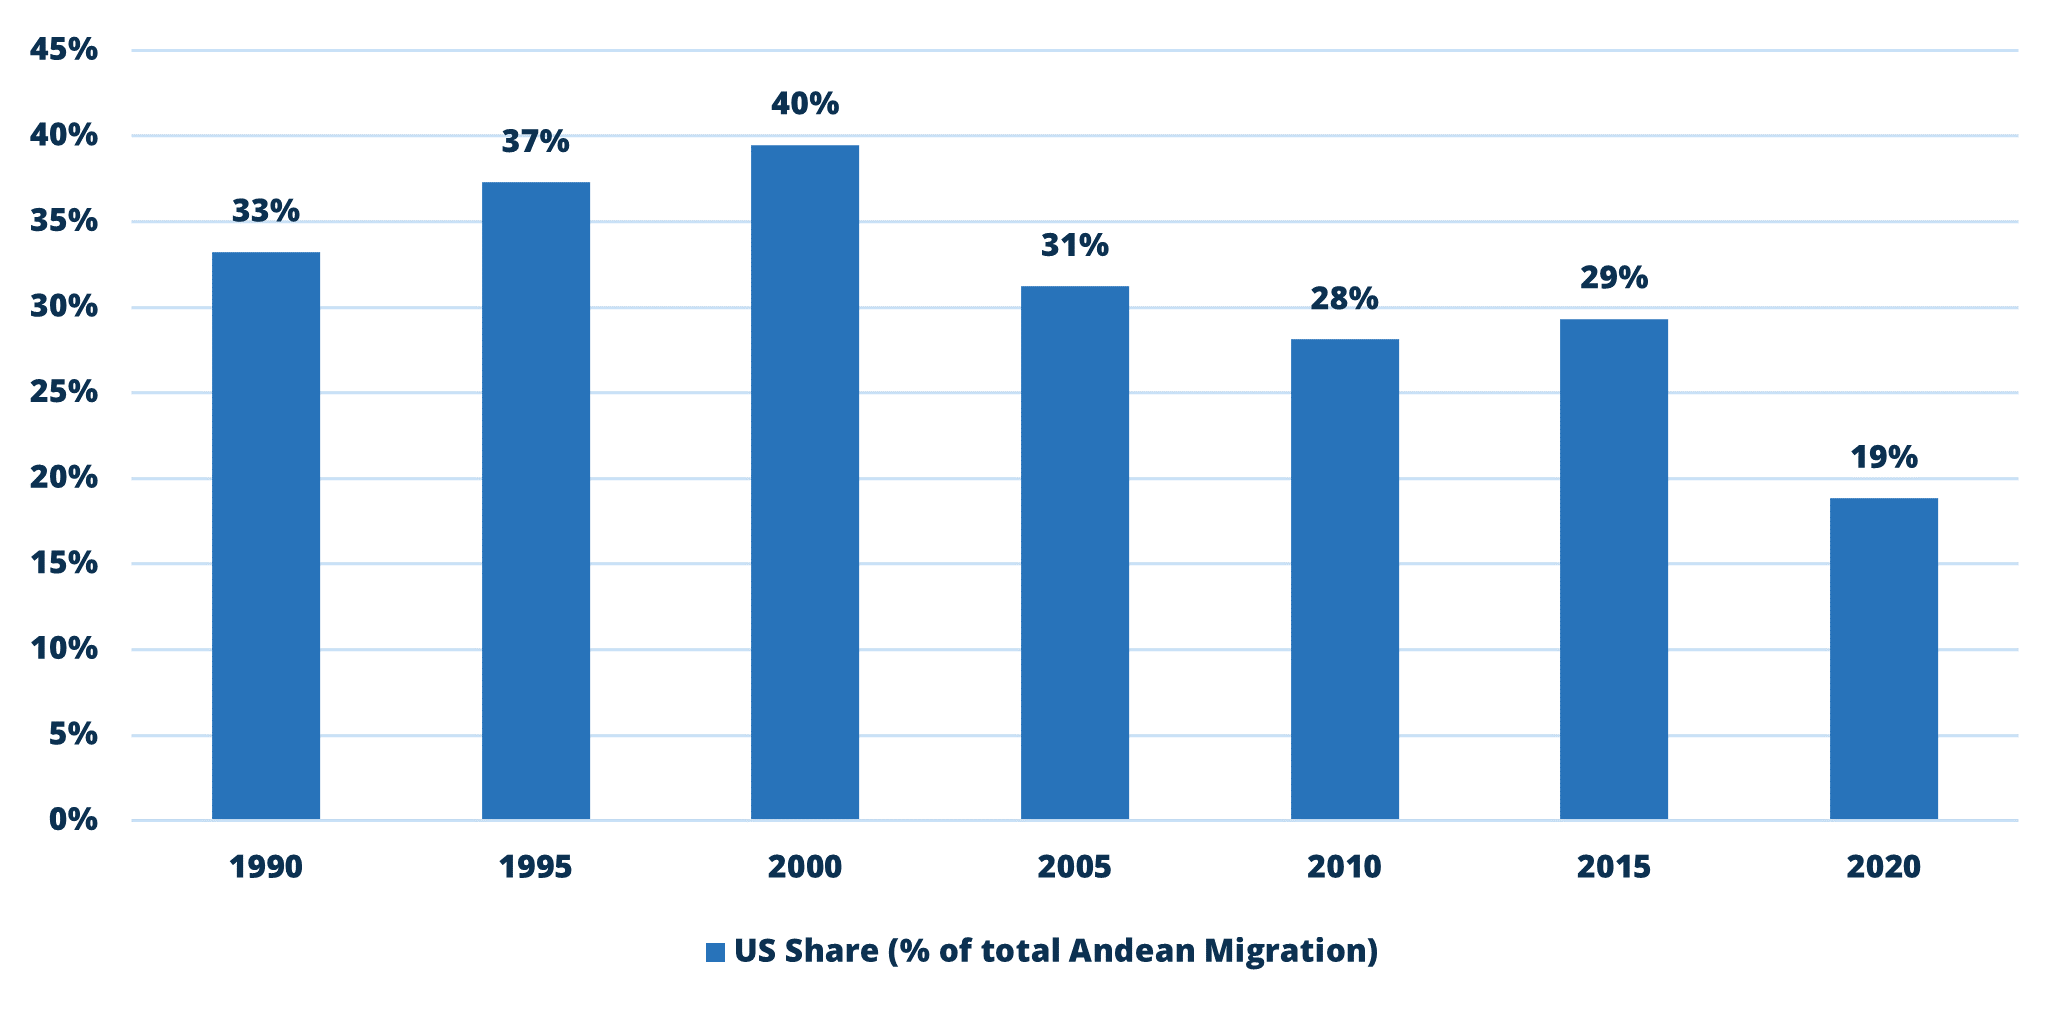
Central to this pattern is the United States as a major destination or migrant host country, though in decreasing numbers relative to total migration to the US. Andean migrants in the US accounted for 33 percent in 1990 and dropped to 20 percent in 2020 as a share of all Andean migrants worldwide.
Migrants from the Andes region, in general, are considering multiple destination countries, and their proportion of US immigrants has only risen from four percent to just under six percent over the past two decades.
Additionally, as migrants continue to journey to traditional destination countries like the US and Spain, they are increasingly staying within the Latin America and the Caribbean (LAC) region. This number has been growing steadily in each country since the 1990s and in just five years, the number of Venezuelans who left their country for another in the LAC region grew from 175,000 in 2015 to over four million in 2020. As of 2022, this number is now over five million, according to the UN. Therefore, Andean migration is not only a relevant trend for the US, but also countries in the region – even if intraregional migration is transitory[3], as the numbers may suggest.
FIGURE 4: US DESTINATION SHARE (PERCENT OF TOTAL ANDEAN MIGRATION)
Source: United Nations Department of Economic and Social Affairs (UNDESA), 2020.
FIGURE 5: US BORDER ENCOUNTERS OF MIGRANTS FROM ANDEAN COUNTRIES, 2019-2024
Source: Department of Homeland Security (DHS), 2024; Note: Bolivia is not included in DHS encounter data
FIGURE 6: SHARE OF ANDEAN MIGRANTS IN US (PERCENT OF TOTAL FOREIGN-BORN POPULATION IN US), 2000-2022
Source: US Census Data (2000-2023), ACS figures.
TABLE 1: ANDEAN MIGRANT POPULATION IN THE US, 2022
|
Country |
2022 |
|
Bolivia |
85,851 |
|
Colombia |
928,053 |
|
Ecuador |
518,287 |
|
Peru |
471,988 |
|
Venezuela |
667,664 |
|
Andean Region |
2,671,843 |
Source: US Census Data, 2000-2023
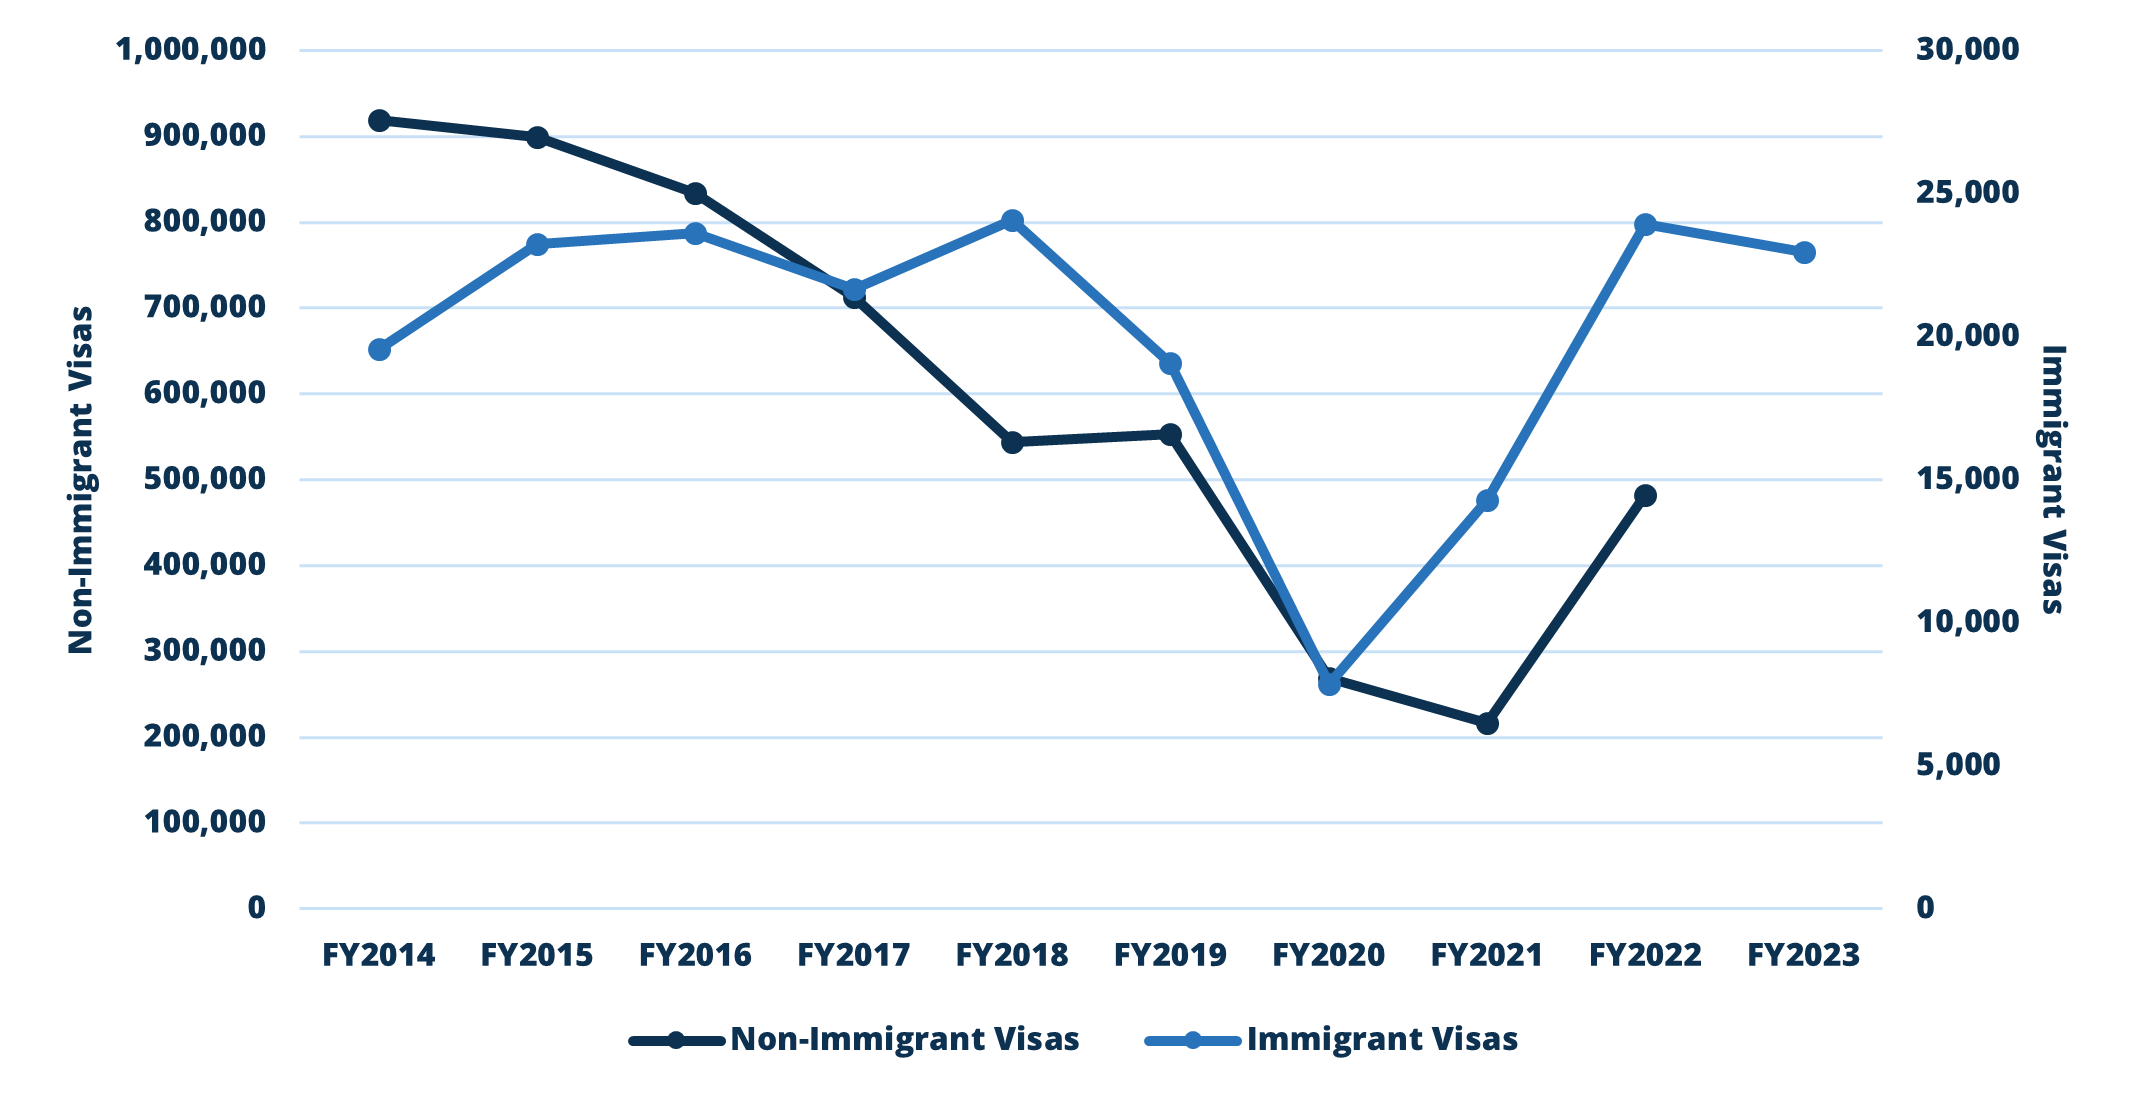
FIGURE 7: US VISAS GRANTED TO ANDEAN MIGRANTS, FY2014-FY2023
Source: US Citizenship and Immigration Services (USCIS), 2014-2023
Remittances from the Andean Region
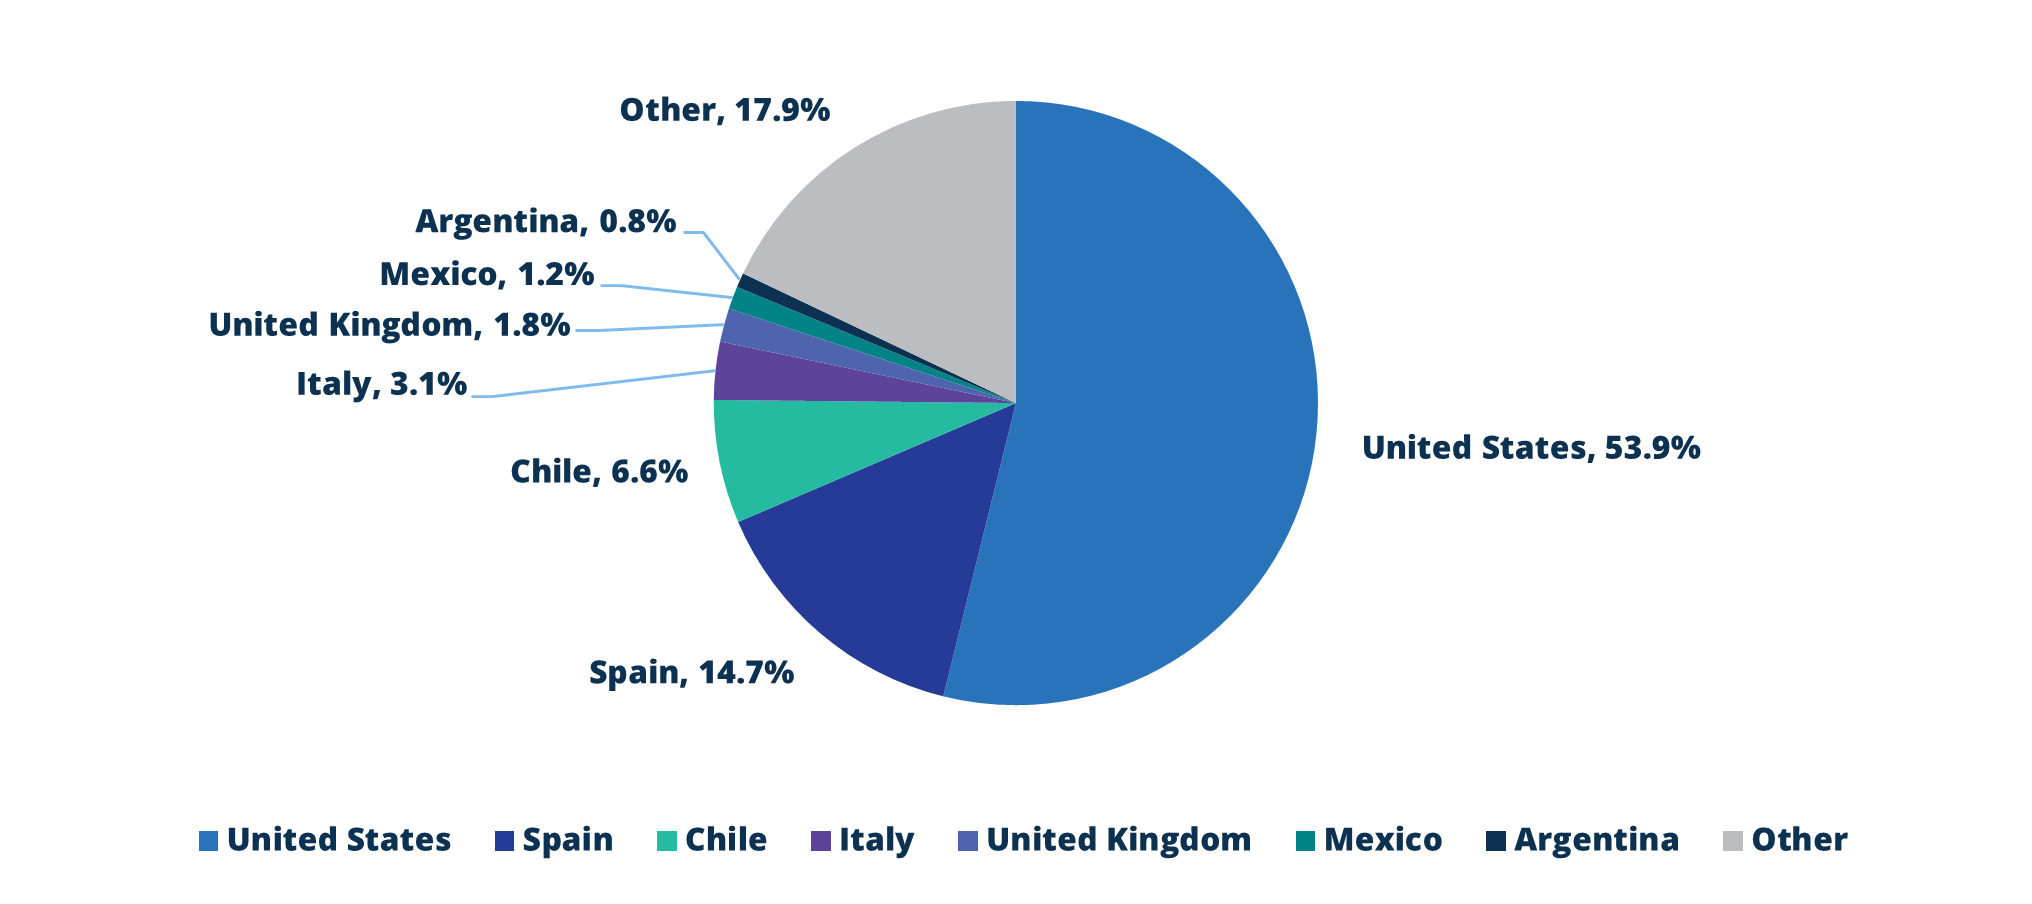
According to Comunidad Andina in 2022, the Andean countries received over US$20 billion, 53 percent of which came from the United States. Compared to LAC region’s nine percent growth in remittances from 2022 to 2023[4] from the US, growth was stronger in the Andes at 11.5 percent. The US share of these flows not only stem from migration but also larger remitted principal amounts than other origin countries, including Spain.
Migrants in the US tend to send more than 15 times a year and in averages sent close to US$400. The highest and most consistent growth in principle sent has been in Colombia and Ecuador, both with a ten-year average growth rate of 10 percent. A pricing analysis[5] conducted by the Inter-American Dialogue in January 2024 found that the average cost of sending US$ from the US to Colombia was 3.54 percent – slightly higher than the average cost for the LAC region, 3.22 percent.
FIGURE 8: ANDEAN REMITTANCE ORIGINS IN 2022
Source: Comunidad Andina, Member State Central Banks. Decisión 756, Resolución 1433.
TABLE 2: AVERAGE REMITTED FROM US TO THE ANDEAN REGION (USD$)
|
Year |
Peru |
Venezuela |
Bolivia |
Colombia |
Ecuador |
|
2012 |
$244 |
$138 |
$485 |
$231 |
$204 |
|
2013 |
$237 |
$132 |
$495 |
$236 |
$202 |
|
2014 |
$221 |
$128 |
$472 |
$231 |
$202 |
|
2015 |
$214 |
$96 |
$503 |
$238 |
$208 |
|
2016 |
$231 |
$514 |
$241 |
$194 |
|
|
2017 |
$237 |
$581 |
$244 |
$197 |
|
|
2018 |
$237 |
$550 |
$252 |
$230 |
|
|
2019 |
$236 |
$570 |
$257 |
$350 |
|
|
2022 |
$344 |
$417 |
$510 |
$313 |
$468 |
|
2023 |
$336 |
$425 |
$510 |
$494 |
$419 |
Source: Money transfer companies originating flows from the US
TABLE 3: VOLUME OF REMITTANCES FROM US TO THE ANDEAN REGION, 2022-2023 (in millions US$)
|
Volume of Remittances from the US |
Peru |
Venezuela |
Bolivia |
Colombia |
Ecuador |
Andean Region |
|
2022 |
$2,244.53 |
$2,382.73 |
$518.92 |
$4,086.31 |
$3,202.80 |
$10,052.58 |
|
2023 |
$2,574.64 |
$2,934.83 |
$541.87 |
$4,572.02 |
$3,517.52 |
$11,206.07 |
|
Growth |
14.7% |
23.2% |
4.4% |
11.9% |
9.8% |
11.5% |
Source: Author estimates using migration, and average remittance figures
TABLE 4: ANDEAN REMITTANCE ORIGINS, 2017-2022
|
Country |
2017 |
2018 |
2019 |
2020 |
2021 |
2022 |
|
United States |
41.7% |
42.5% |
44.5% |
49.8% |
50.1% |
53.9% |
|
Spain |
17.7% |
18.3% |
18.0% |
18.0% |
17.1% |
14.7% |
|
Italy |
3.9% |
3.7% |
3.5% |
3.6% |
3.4% |
3.1% |
|
United Kingdom |
1.5% |
1.3% |
1.5% |
1.9% |
1.6% |
1.8% |
|
Chile |
6.2% |
6.5% |
6.5% |
6.7% |
8.0% |
6.6% |
|
Mexico |
1.5% |
1.5% |
1.4% |
1.1% |
1.3% |
1.2% |
|
Argentina |
3.4% |
2.6% |
1.7% |
1.0% |
1.0% |
0.8% |
|
Other |
24.0% |
23.5% |
22.9% |
17.8% |
17.5% |
17.9% |
|
World (Millions USD) |
$12,964.52 |
$14,261.59 |
$14,965.32 |
$14,300.90 |
$17,950.03 |
$19,333.24 |
Source: Comunidad Andina, Member State Central Banks. Decisión 756, Resolución 1433, 2022.
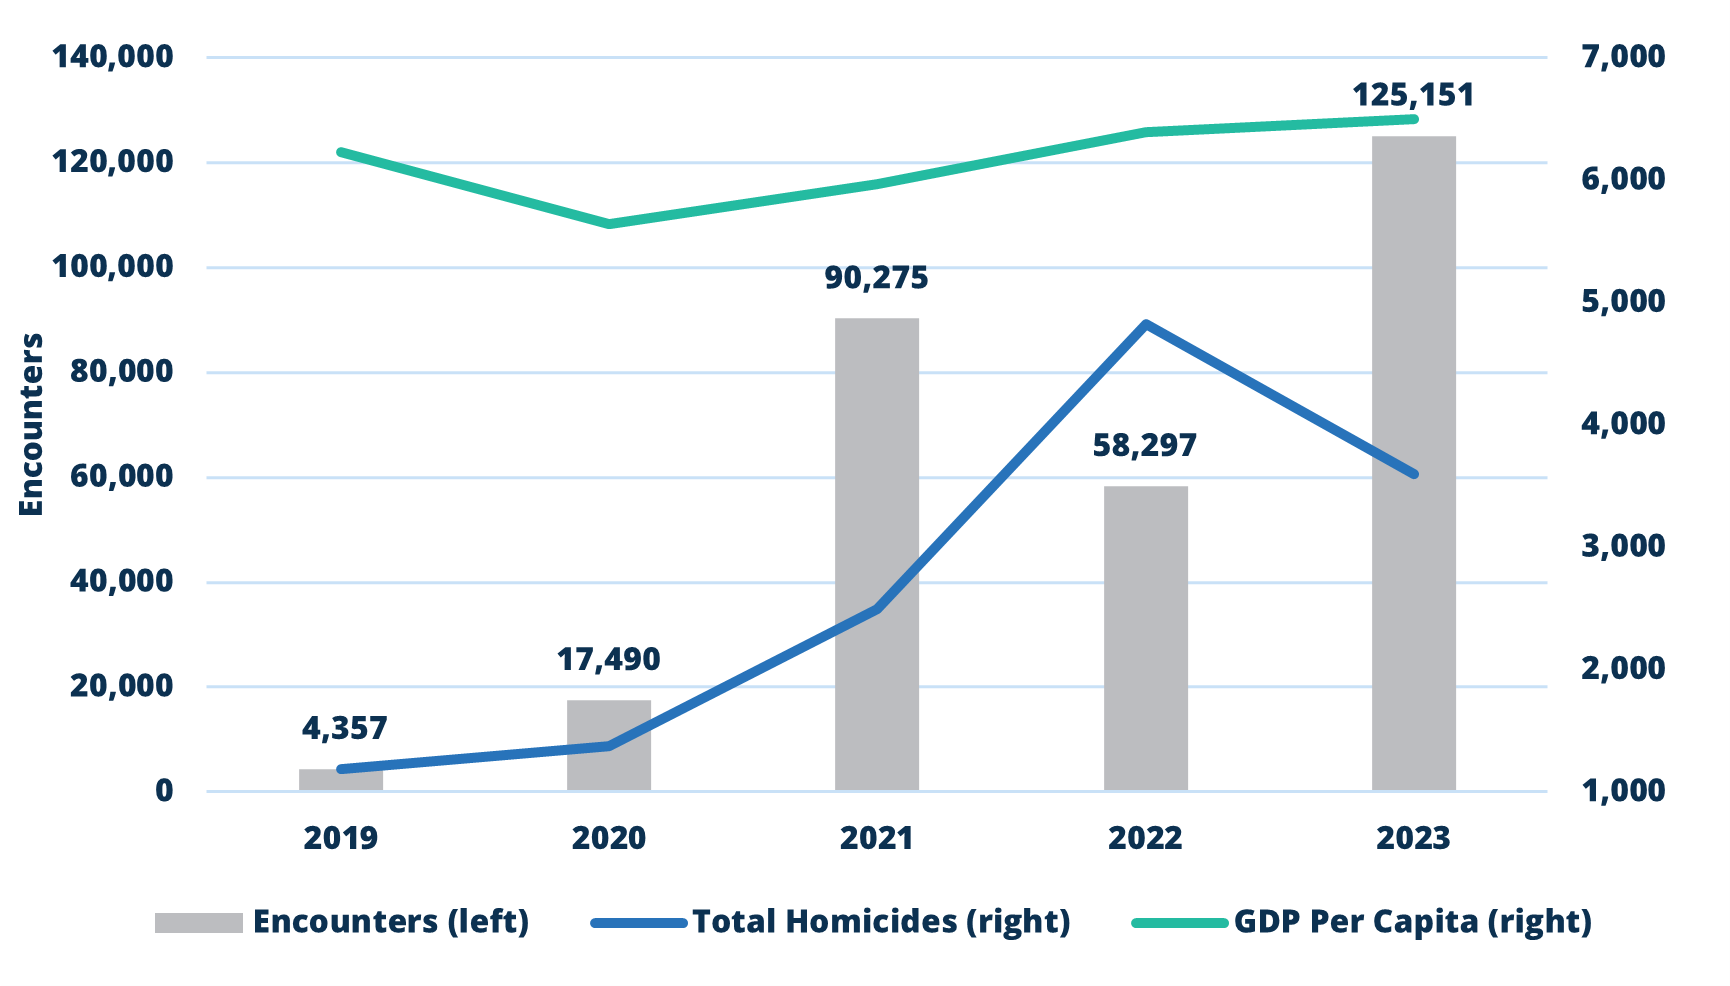
FIGURE 9: ECUADORIAN ENCOUNTERS AND MIGRATION FACTORS, 2019-2023
Source: Observatorio Ecuatoriano de Crimen Organizado (OECO), Department of Homeland Security (DHS) – Note: 2019 contains only Q4 numbers, World Bank Data, 2024
ENDNOTES
[1] Equilibrium CenDE, a public opinion and research firm based in Lima reports their survey data.
[2] Lupu, Noam, Mariana Rodríguez, Carole J. Wilson, and Elizabeth J. Zechmeister (Eds.) 2023. Pulse of Democracy. Nashville, TN: LAPOP.
[3] Muñoz, Betilde, and Alexandra Winkler. 2023. “The Persistence of the Venezuelan Migrant and Refugee Crisis.” CSIS.
[4] Orozco, Manuel, and Patrick Springer. 2023. “2023 in Remittances: The Year in Review – The Dialogue.” Inter-American Dialogue. https://thedialogue.org/analysis/2023-in-remittances-the-year-in-review/.
[5] Orozco, Manuel, and Patrick Springer. 2024. “Transaction Costs and Money Transfer Operators – A Review of Costs by MTO Receiving Countries.” Inter-American Dialogue. https://thedialogue.org/analysis/transaction-costs-and-money-transfer-operators-a-review-of-costs-by-mto-receiving-countries/.


